
First, it’s important to understand that traffic delay at rail crossings comprises two periods: (1) delays that occur while the train is occupying the crossing (the blockage period) and (2) delays that occur after the train has cleared the crossing (the recovery period). It turns out that 1/3 of traffic delay occurs during the blockage period and the remaining 2/3 of delay occurs during the recovery period.
Second, it’s important to understand that most models and approaches for measuring traffic delay at rail crossings fail to accurately account for the delay during the recovery period. If you’re using traffic simulation models or traffic engineering formulas, chances are high that you’re grossly underestimating traffic delays at rail crossings, likely by a factor of 5 or more (i.e., traffic delays are likely more than 5 times longer than estimated by traffic models).
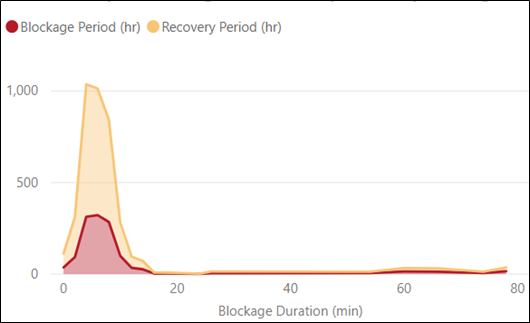
Consider the graph below showing traffic delay at rail crossings in London, Ontario (Canada) over a one-year period. This graph shows traffic delay for each blockage period duration observed; i.e., for trains that occupied the crossing for 1 minute and including several trains that occupied the crossing for nearly 80 minutes each. The graph also disaggregates traffic delay by blockage (red) and recovery (yellow) period. Across all blockage durations, from a 1-minute train to an 80-minute train, the traffic delay during the recovery period is consistently 2x greater than traffic delay during the blockage period.
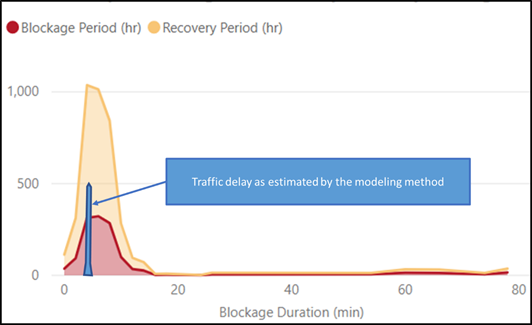
Now take a look at the same graph, except with the amount of traffic delay estimated by traffic models overlaid in blue. These models estimate a small sliver of the total delay at rail crossings. Specifically, models measure traffic delay for an average blockage duration (in this example, 5-minutes) and rarely capture the full recovery period (in this example, only a fraction of the yellow recovery period is measured). This graph demonstrates that traffic delays at rail crossings are typically much longer than traffic models estimate. For more details on modeling traffic delays at rail crossings, check out my blog on this topic here.
The Importance of Quantifying Traffic Delay During the Blockage and Recovery Periods
If traffic delays at rail crossings are 5-7 times greater than currently estimated, would this impact how you prioritized projects to improve traffic congestion? Have you ever submitted a budget request for rail crossing improvement projects or applied for federal/state programs to help fund these projects and been rejected? Have you ever implemented countermeasures to reduce traffic delays at rail crossings and been underwhelmed by the outcome? If you answered yes to any of these questions, understanding and quantifying traffic delays during the blockage and recovery periods can help.
Armed with reliable traffic delay at rail crossing information, you can:
- Confidently rank projects to address the most significant sources of traffic delay and increase your chances of getting rail crossing projects incorporated into your organization’s budget,
- Significantly increase the benefit-cost ratio for rail crossing improvements to improve your chances at obtaining federal or state funding to support these projects, and
- Select targeted countermeasures to effectively address root causes of traffic delays at rail crossings.
You’ve just seen how modeling traffic delays at rail crossings provides a severely incomplete understanding of the issue; however, you may be using these models to identify countermeasures and evaluate their effectiveness. This can cause one of the following problems.
- Your solutions are under-designed, since they are not intended to treat the full problem – only the small blue sliver. The result: underwhelming and disappointing countermeasure results.
- Your solutions are unlikely targeting the different types of delays that occur during the blockage and recovery periods. The result: countermeasures that do not target the root cause of traffic delays at rail crossings.
- Your solutions are over-designed. Without deep insight into traffic delays at rail crossings, you’re at risk of selecting expensive options like grade separation that ensure traffic delays are eliminated when cheaper options are available that can reduce traffic delays to acceptable levels. The result: wasteful spending and misallocation of resources.
Selecting & Evaluating Countermeasures to Reduce Traffic Delays at Rail Crossings
When you fully understand and disaggregate the traffic delay impacts during the blockage and recovery periods, you can identify targeted countermeasures that are effective at reducing these delays and won’t cost you millions of dollars. The following table outlines potential countermeasures to consider. Some of these countermeasures rely on advanced traveler information systems that can predict traffic delays at rail crossings before trains arrive and communicate these delays to drivers. To learn more about these systems and how TRAINFO can help, please visit our website at www.trainfo.ca.
| Period | Countermeasure | Description |
| Blockage Period | Re-route traffic | Provide re-route options for traffic to avoid blocked crossings to reduce the number of vehicles delayed by a train |
| Adjust traffic signals before the train arrives | Maximize vehicle throughput across railway tracks before train arrives to reduce the number of vehicles delayed by a train | |
| Provide travel delay information | Inform drivers about how much delay to expect at a rail crossing as a way to help them plan for this delay and mitigate frustration | |
| Recovery Period | Re-route traffic | Fewer vehicles stopped at rail crossings means shorter queues and faster recovery times |
| Adjust traffic signals after crossing clears | Trigger traffic signal timing plans that are designed to handle a surge in traffic volumes after the crossing clears | |
| Provide or extend turning lanes | Auxiliary lanes after rail crossings can help clear traffic quickly after the crossing clears |