
Modeling Traffic Delay at Rail Crossings
How traffic models work
The modeling approach applies traffic engineering theories to estimate traffic delays at rail crossings. Due to insufficient rail crossing blockage data and travel speed data, this approach relies on many incorrect assumptions [2]. Basically, models assume traffic volumes, hourly distribution, speed (and other traffic characteristics), vehicle acceleration, deceleration (and other vehicle performance characteristics), and train volumes, hourly distribution, speed, length (and other train characteristics).
Major assumptions and errors made by traffic models
Most models assume the following:
- Number of rail crossing blockages per day based on the “average daily train volume”
- Rail crossing blockage duration based on an assumed “average gate down time”
- Number of vehicles delayed based on an “average daily traffic volume” and “average deceleration rate” to estimate the “average vehicle queue”
- Traffic recovery period (i.e., average time for traffic to return to the “average travel speed” after the train clears) based on an average vehicle’s “average acceleration rate”
As you can see, there are a lot of averages! Averages are usually fine for normally distributed data (i.e., fits a bell curve), but most data in these models are not normally distributed.
These assumptions lead to fundamental flaws in most models, including two outlined below which cause the most errors:
- Models assume that all blockages are caused by through moving trains and that each blockage is the same duration. However, many crossings are also blocked by other movements such as switching trains. Often, it’s these other movements that cause the longest delays.
- Models distribute daily train volumes equally throughout the day. However, most blockages are somewhat random, particularly for freight trains. Further, some blockages occur back-to-back which can cause long delays.
To make matters worse, most models rely on the following data which is typically highly inaccurate:
- Average Daily Train Volume – Obtained from railroad and federal databases, this data rarely provides accurate switching and shunting movement data and does not account for hourly and daily variations. Short-term manual train counts are occasionally used instead and usually misrepresent long term trends.
- Average Gate Down Time per Train – Obtained from railroad and federal databases, this data provides gate downtime for through train movements only and does not account for wide variations in gate downtime. Short-term manual counts are occasionally used instead and usually misrepresent long term trends.
- Average Daily Traffic Volume – Obtained from road authority databases, this data can be several years old, was often collected from short-term counts which usually misrepresents long term trends, and does not account for the actual number of vehicles delayed by a crossing blockage.
Why are traffic models used?
Traffic models are a popular option for estimating traffic delays at rail crossings because they are quick, easy, and cheap. Most transportation professionals have modeling software, many of the modeling variables are readily available, and the time and effort to build a model is relatively low. However, these benefits come with a cost – poor accuracy.
Traffic model results
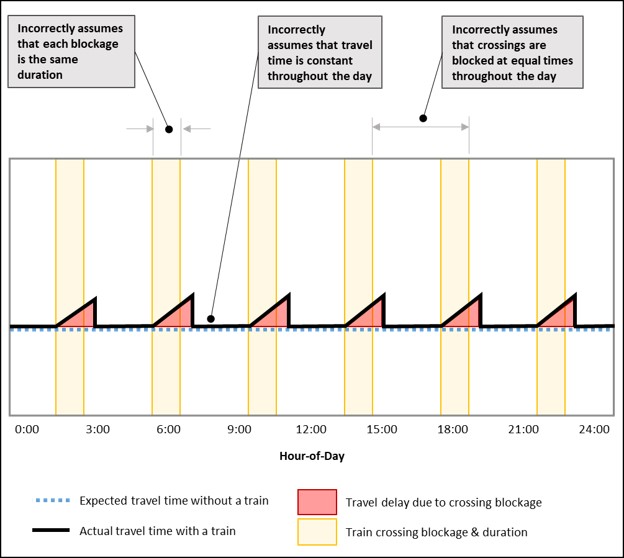
The figure below illustrates the modeling approach. The model assumes a baseline travel time without a train (blue dashed line), introduces uniform through-moving trains at equal intervals throughout the day (yellow bars), models the change in travel time due to the train (black line), and estimates the delay as the difference between baseline travel time (red triangle).
Measurement Method for Quantifying Traffic Delay at Rail Crossings
How traffic delay measurement at rail crossings works
The measurement approach uses actual crossing blockage and traffic delay data to determine traffic delays at rail crossings. This approach removes the guesswork and provides accurate, reliable information. However, until now, this approach was rarely used due to a lack of data and effective analytical tools [3].
Challenges measuring traffic delay
The main data challenges are obtaining detailed train movement data and collecting individual vehicle travel speed data along a corridor. Even with this data, the main analytical challenges include determining which vehicles were impacted by the train (and which were turning into McDonald’s to pick up a coffee, for example).
Solution: New sensors and advanced analytics
Two types of sensors and machine-learning algorithms are used to address these challenges.
Train detection sensors. TRAINFO’s new train detection sensors offer an easy, low-cost, reliable, and accurate option to determine exactly when a rail crossing is blocked. You don’t need approval from the railroad to install these sensors because they can be fixed to any pole on public property within 100 ft of the crossing.
Travel time sensors. Bluetooth sensors installed along the roadway can obtain a statistically significant sample of vehicle travel time over rail crossings. These sensors are also highly accurate, reliable, and cost-effective.
Machine-learning algorithms. You would think that once you have detailed train and traffic data for individual vehicles it would be pretty straightforward to simply calculate traffic delay. Not so fast. Turns out there are some thorny details to resolve, including the McDonald’s example above and many more. These are complex issues that are too technical for this blog post. This is where machine-learning algorithms come into play.
Armed with train sensors, Bluetooth sensors, and machine-learning algorithms, it is possible to accurately measure traffic delay at rail crossings. Sensors continuously collect data and can be installed for several months or indefinitely. This addresses any seasonality effects and allows you to collect data across a wide road network. This data is wirelessly transmitted to the cloud where machine-learning algorithms calculate traffic delay in near real-time. Once you have this data, many types of performance metrics can be produced, including average vehicle-delay per blockage, total vehicle delay, average vehicle-delay per hour, etc.
Traffic delay measurement results
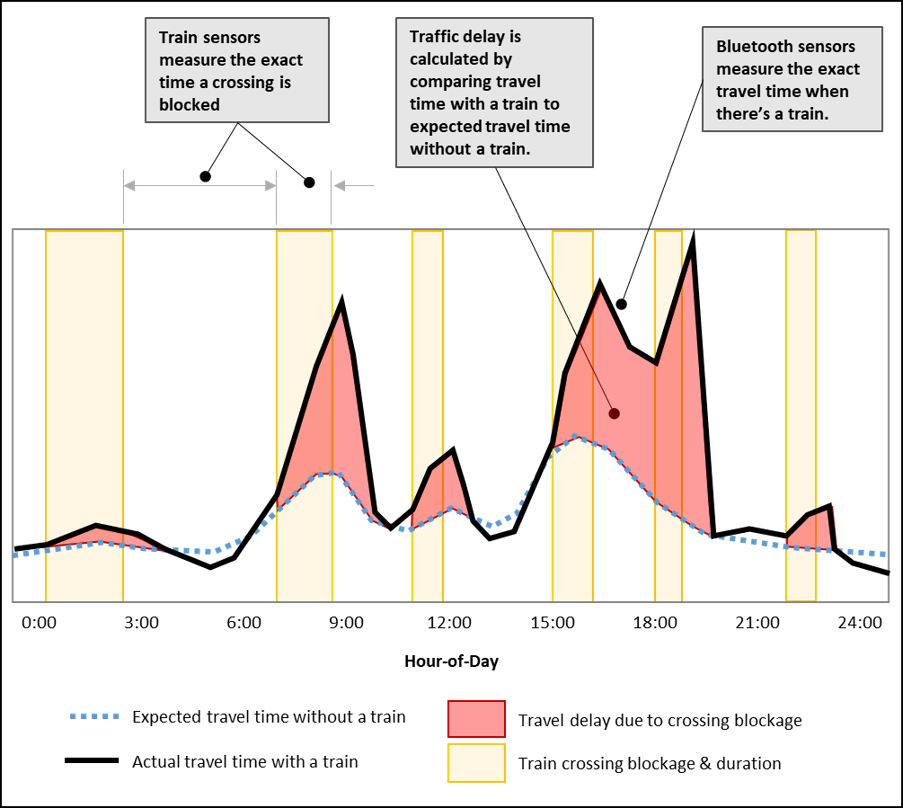
The figure below illustrates the measurement approach. Compare this to the modeling illustration and the differences are obvious. For example, the measurement approach accounts for long train delays during peak traffic periods, captures the impact of back-to-back rail crossing blockages, minimizes the effect of trains during off-peak periods, and, as will be discussed in a later post, includes the full effect of traffic delays after the train clears the crossing.
Why you should consider measuring traffic delay at rail crossings instead of modeling it.
The appeal of models includes speed, ease, and cost to estimate traffic delay; however, the downside includes relying on many incorrect assumptions that significantly affect accuracy. New technologies provide the ability to measure traffic delay at rail crossings with similar ease and cost as traffic models but with accuracies that are orders-of-magnitude better than modeling.
Why does this improved accuracy matter?
In my next post, I’ll provide a real-world example to demonstrate that these differences are not just conceptual but that they can significantly impact how you prioritize roadway projects and whether you receive millions of dollars in federal funding.
References
[1] G. Rempel, “Using ITS to Measure and Mitigate Traffic Congestion at Railroad Crossings,” in ITS America, Detroit, MI, 2018.
[2] J. Appiah and L. Rilet, “Microsimulation Analysis of Highway-Rail Grade Crossings: A Case Study in Lincoln, Nebraska,” in IEEE/ASME Joint Rail Conference, Wilmington, DE, 2008.
[3] Chicago Metropolitan Agency for Planning, “Highway Capacity Measurements: Grade Crossing Saturation Flows,” 2015.